Student Jessica Giles Creates Map to Track People’s Movements During the Pandemic

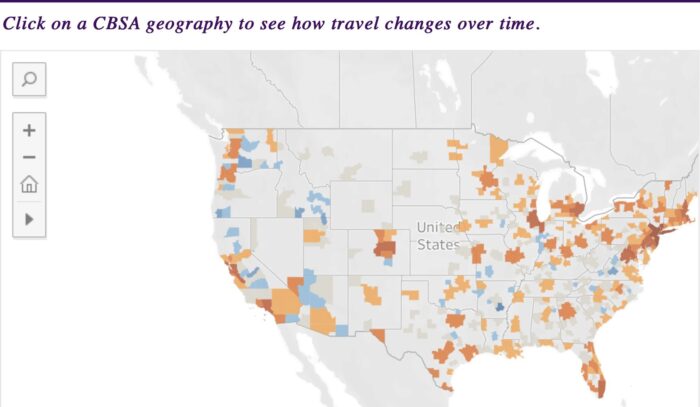
One of the reasons student Jessica Giles entered the MSIS program was to learn how to better represent data through visualization for her job as an associate data engineer at Intermx in Atlanta, Georgia. She had hoped to gain skills that would allow her to put data and statistics into an easy-to-consume format for the public. Her most recent work project achieved just that: Giles used data of people’s movements during the COVID-19 pandemic and placed it into an interactive map with adjacent graphs that anyone can access and use.
While the idea for the map initially stemmed from clients who work in out-of-home advertising, the map has been used in a variety of ways since it went live, Giles said.
“One of the cool things it was used for by a visitor was to visualize the potential rise in COVID-19 cases if we don’t follow stay-at-home guidelines,” she said. “It’s been interesting to see what people can do with this data.”
Giles earned her undergraduate degree in geographic information science from Kennesaw State University; that degree focused a lot on cartography and mapping technology, and she wanted to delve more into data science. She said she chose the program at the University of Tennessee, Knoxville, because it allows students to pick their own pathways.
“There’s a lot of flexibility in the courses I can take–there’s three required courses and then I can build the rest of my classes around what is most helpful for my job and my career,” she said.
She made it a point to take Data Analytics and Visualization early on, which is the class where she learned the visualization software Tableau that she used to create her movement map and graphs. Part of the reason she felt that class is important for her job is because of the need to provide data in a client-friendly format.
“When you have all these data and numbers, it doesn’t mean anything, but you can turn it into something impactful such as a map, a chart or a graph,” she said.

A screenshot of the interactive map Jessica Giles created to track movement during the COVID-19 pandemic.
Giles also took Data Management in spring 2020, and learned how to properly manage data, extract it, and represent it in the best format possible. Part of her job is to explain technical subject matters to clients, and to represent it to them in various ways, and she says taking these classes has enhanced her ability to do that.
“I feel like what I’ve learned in this class has really helped me to be able to cater to what a client would want to see, but also how to manage data on the backend as well. The combination of the two has really helped me,” she said.
She found her movement map project to be somewhat challenging, especially managing a live connection to a database in Tableau. The database updates daily, and Giles had to ensure her website would refresh every morning with the new information. She said another challenge was creating the basic layout of the web page, and what graphs and charts would be meaningful to represent the information. While it was a challenge, it’s been a satisfying one, and Giles said she looks forward to doing more projects like this in the future.
“I think information sciences is so important, especially right now because we can share and make such an impact with the data we provide. I’d like to use this information to help, whether it be during a pandemic like this, or any other challenging events we may face in the future,” she said.